
Industrias PeñOles S A B De C V
PE&OLESIndustrias Peñoles, S.A.B. de C.V. is a major Mexican mining and metals company with integrated operations spanning precious and base metals. Through its subsidiary Fresnillo plc (LSE: FRES) and its own Metallurgical and Chemical divisions, Peñoles is one of the world's largest silver producers and a significant gold, zinc, and lead producer.
The company's portfolio is anchored by world-class Mexican mining assets including the Fresnillo silver mine, the Saucito mine, the Herradura gold mine, and the Peñoles metallurgical complex in Torreón. Fresnillo plc operates several of these mines and is publicly listed, while Peñoles retains a controlling interest, creating a unique holding company structure. The Sabinas mine (zinc/lead) and the development of the Juanicipio project further bolster the portfolio.
Financially, Peñoles benefits from strong precious metals pricing. Q3 2025 revenue reached approximately USD 1.98 billion, with net income of USD 301 million. The balance sheet is healthy, featuring nearly equivalent cash and debt positions in the USD 3.8-3.9 billion range. The company holds investment-grade credit ratings of 'BBB' (Fitch, S&P).
From a Rick Rule and Don Durrett analytical perspective, Peñoles presents a robust but jurisdictionally concentrated investment. The Tier 3 (Mexico) jurisdiction risk introduces regulatory and security headwinds. However, the company's vast resources, established infrastructure, and formidable silver and gold production base offer solid fundamental value at current commodity prices. Margin potential is substantial given the elevated price of silver, though operational cost inflation and Mexican regulatory dynamics remain key watchpoints.
Data Quality
Market Cap
$20.22B
Total valuation
Stock Price
$51.00
▲ 2.46% today
Free Cash Flow
N/A
Annual
Financial Position
-$178.48M
Net debt position
PEG Ratio
ⓘN/M
Not meaningful
Analysis
Score Interpretation
Hover any criterion below to reveal its full rationale, key metrics, strengths, concerns, and source documentation.
Criterion Detailed Analysis
Recommendation
Industrias Peñoles is a fundamentally solid major silver and gold producer with a unique integrated metallurgical advantage. The primary investment drawback is its 100% concentration in Mexico (Tier 3), which carries regulatory and security risks. However, the company is generating robust free cash flow at current elevated precious metals prices and maintains a near net-cash balance sheet, making it a fair-value opportunity for investors seeking leveraged exposure to the silver market.
Red Flags
| Criterion | Severity | Score | Description |
|---|---|---|---|
| jurisdiction | Medium | 5.00 | 100% of operations located in Mexico, exposing the company to regulatory changes, resource nationalism, and security risks. |
| cost_structure | Low | 6.00 | Operating in the second to third quartile of the cost curve limits margin protection during metal price downturns. |
Scenario Analysis
Bull Case
Bull case: Silver prices sustain above $35/oz and gold remains elevated, driving substantial FCF growth and multiple expansion.
Base Case
Base case: Current metal prices are largely maintained; the company continues steady production and debt reduction.
Bear Case
Bear case: Silver prices retreat, and operational costs in Mexico continue to inflate, squeezing margins.
Audit Trail
| # | Source |
|---|---|
| 1 | Evidence Ledger Data: Market timing indicators, total debt (USD 3.99B), and cash equivalents (USD 3.80B) verified via Yahoo Finance source as of 2026-07-08. |
| 2 | Q3 2025 Financial Report (penoles.com.mx): Revenue of USD 1.98B, Net Income USD 301M. |
| 3 | Simply Wall St / Forbes: Confirmation of CEO Rafael Rebollar González since Jan 2021. |
| 4 | Fitch Ratings (Oct 2024): Reaffirmed 'BBB' rating; noted second to third quartile cost position. |
| 5 | Form 6-K / Fresnillo plc Reports: Reserve and resource estimates for Fresnillo, Saucito, and Juanicipio projects. |
Financials
Core Metrics
Annual Production
N/A
Troy oz per year
Revenue
$7.56B
Latest reported
Net Income
$1.72B
Annual
Enterprise Value
$16.96B
Net debt: $178.48M
Adj. EBITDA
$2.86B
EV/EBITDA 5.92x
Income & Cash Flow
Waterfall · Revenue to Free Cash Flow
Key P&L Ratios
N/A
Free Cash Flow Generated
Balance Sheet & Leverage
Capital Structure
- Equity $12.18B
- Long-Term Debt $3.28B
- Short-Term Debt $539.67M
- Cash & Equivalents $3.64B
Leverage & Coverage
$178.48M
Net Debt (Strong)
Cash Uses & Returns
- Capital Expenditures $1.16B
- Dividends Paid $273.32M
- Share Buybacks $0.00
- Interest Expense $0.00
- Debt Repayment / Other $1.47B
Profitability & Returns
Returns
Margins
Liquidity & Coverage
Yield
Valuation
Valuation Multiples
Share Structure & Ownership
Share Structure
- Outstanding 398.92M 398.92M
- Options 3.00M 3.00M
- RSUs 2.00M 2.00M
- Warrants 0.00 0.00
Per-Share & Buyback Metrics
$0.00
Remaining Buyback Capacity
Health Indicators
Strength across all solvency and liquidity metrics
31.0% of 1.0x threshold
2.0% of 3.0x threshold
100.0% of 3.0x target
100.0% of 48 months target
8.3% of 15% threshold
Asset Pipeline
Jurisdiction Exposure
Geographic distribution of mining properties · Equal-weighted (no NPV data)
- Mexico100.0% · Tier 3 · 6 properties
Operating Mines
Distribution across development stages · Equal-weighted (no NPV data)
- Production (Steady-State)83.3% · 5 Assets
- Production (Ramp-Up)16.7% · 1 Asset
Cost Structure
All-in Sustaining Cost (AISC) breakdown • Peer-leading efficiency
$798/oz • 70%
$171/oz • 15%
$171/oz • 15%
Fresnillo Mine
Fresnillo plc (Holding)
Herradura Gold Mine
Juanicipio Project
Peñoles Metallurgical Complex (Torreón)
Saucito Mine
Information
Key Information
Legal Entity
Industrias PeñOles S A B De C V
Sector
Precious Metal
Employees
15,611
Reporting Currency
MXN
Contact Phone
52 55 5279 3000
Website
www.penoles.com.mxHeadquarters Address
Calzada Legaria No. 549 , Mexico City , DF 11250 , MX
Commodity Portfolio
Liquidity
- Avg dollar volume (50d)
- —
- Last trade date
- Oct 9, 2026
- Days since last trade
- 3
- Last evaluated
- Oct 12, 2026 10:30 PM
Stock Exchanges
Organization
Management Team
Rafael Rebollar González
Chief Executive Officer
Mines built: 1
Insider Ownership
0.01%
Mauricio Ivan Garcia Torres
Chief Financial Officer
Insider Ownership
0.01%
Mr. Benito Noguez Alcantara
Vice President, Exploration
Insider Ownership
0.00%
Industry Partnerships
MAG Silver Corp
Joint Venture
Project: Juanicipio
Ownership: 43.0%
Source: MAG Silver filings, Fresnillo plc reports
Partner Market Cap
$1.50B
Chart
Interactive chart powered by TradingView. Use the chart tools to analyze price trends.
Videos
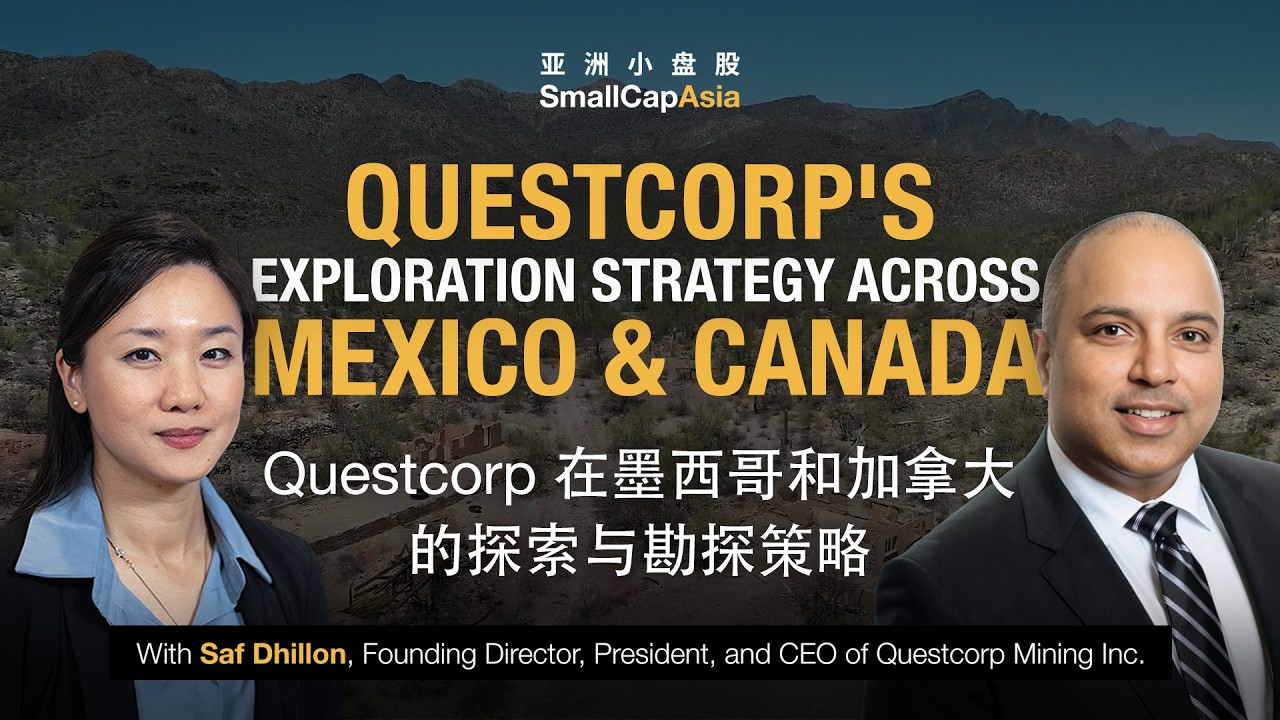
Questcorp Mining ($QQQ | $QQCMF) CEO on Drilling a High-Grade Gold Project in Mexico
Key Highlights
brief- The guest notes Peñoles (referred to as 'Pinoles' in the transcript) was a small operator in the 1950s that mined high-grade oxide gold at the surface of what is now Questcorp's La Union project, with roughly 50,000 ounces historically produced.
- The guest states Peñoles is now a multi-billion dollar market cap company.
An undrilled high-grade CRD target in Mexico's Sonora Belt, La Union is Questcorp's flagship — the CEO argues it could grow into a major polymetallic deposit. Questcorp is fully funded for a 2,000-meter drill program at La Union, targeting zones near Peñoles's historic 1950s oxide workings. With ~$10M CAD market cap and ~80% of ~100M shares in friendly hands, a discovery at La Union could re-rate Questcorp quickly. Questcorp's Vancouver Island asset sits beside the former BHP mine, where the CEO notes a peer grew from under $10M to over $1B on drilling. Questcorp must spend ~$5.5M on La Union over four years; the CEO says ~$3M is already spent, putting the project ahead of schedule.

Questcorp Mining ($QQQ | $QQCMF | D910): Mexico Gold Drilling Underway, Canada Copper Asset Up Next
Phase two drilling is underway at La Union with Riverside operating, targeting at least 1,500 more metres and September assays. First-phase drilling hit 42 metres at 0.3 g/t gold, with chip channel samples returning 226 g/t silver. A four-year earn-in lets Questcorp take up to 100% of La Union by meeting raise, spend, and share-issuance milestones. The CEO sees Mexican permitting momentum — peers winning permits — as a tailwind that could drive regional M&A. North Island Copper in Tier-1 British Columbia offers large-scale copper upside, with permitting targeted by year-end or early 2027.
Articles
No articles available
Published articles for this company will appear here
Want the full picture on more companies?
Be one of the first.
A room for resource investors taking shape now — independent, spam-free, no hype.